
Pest Pressure Maps
Pest range and pressure maps help you see where a pest or disease risk is realistic before you dig into a full species guide. They are overviews for homeowners, technicians, and educators, not a substitute for a local inspection.
In this section
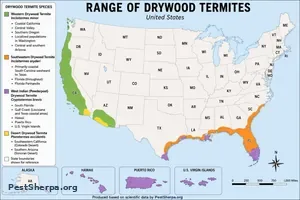
A good map answers a simple question: where does this pest (or this health risk) show up often enough that people should take it seriously? It does not answer whether your attic, crawl space, or yard is infested today. That still takes eyes on the property, and often a species ID.
This section is the home for those overview maps. The drywood termite range map is here now. Mosquito and tick pressure maps belong in the same section as they are added. Each page should say what the figure shows, what it does not show, and how to credit Greg Baumann / Pest Sherpa if you reuse it.
Drywood maps are about structural termites that live in wood without a soil connection. Read the figure as a range overview, then use the drywood termite guide for identification, frass, damage, and control. Validation methods (specimen records, extension surveys, and why older Forest Service prose is not a pixel map) live on the drywood map page.
Future mosquito pressure maps on this site would typically draw from national arbovirus surveillance such as CDC ArboNET, which holds data on infections in people, mosquitoes, birds, and other animals. CDC notes that ArboNET is passive and incomplete, and that provisional and final years should not be mixed casually (CDC ArboNET; CDC West Nile surveillance). Until a Pest Sherpa mosquito map is published here, use those agency tools for activity context, not a Pest Sherpa graphic.
Future tick range or risk overviews would typically draw from collaborative surveillance such as CDC TickNET and related Emerging Infections Program work with state health departments and academia (TickNET overview in Emerging Infectious Diseases; CDC EIP network activities). Tickborne disease geography can be highly focal, and case dots often reflect where a patient lives, which may differ from where they were exposed. Again: agency framing first; a Pest Sherpa tick map joins this section when the figure and caveats are ready.
Pests and pathogens do not follow state lines neatly. Treat every map as a teaching figure with limits, then confirm what you have on site.
This article was written by Greg Baumann, founder of Pest Sherpa, and reflects more than 40 years of professional pest management experience.
About the Author

Greg Baumann | Pest Control Expert
Greg Baumann is the founder of Pest Sherpa and a Pest Control Expert with more than 40 years of professional pest management experience. His articles combine decades of field experience, technical expertise, and science-based guidance to help homeowners identify pests correctly, understand real-world risks, and make informed pest management decisions.
Mission: Identify the pest. Understand the risk. Stop the problem. Prevent the comeback. Know when it’s time to call a professional.